Data Science and Visualization Portfolio
Solo project collection · higher-education datasets
Four solo data studies on US higher-education data: IPEDS pipelines, earnings-model interpretation, research-text topics and synthetic course-review sentiment.
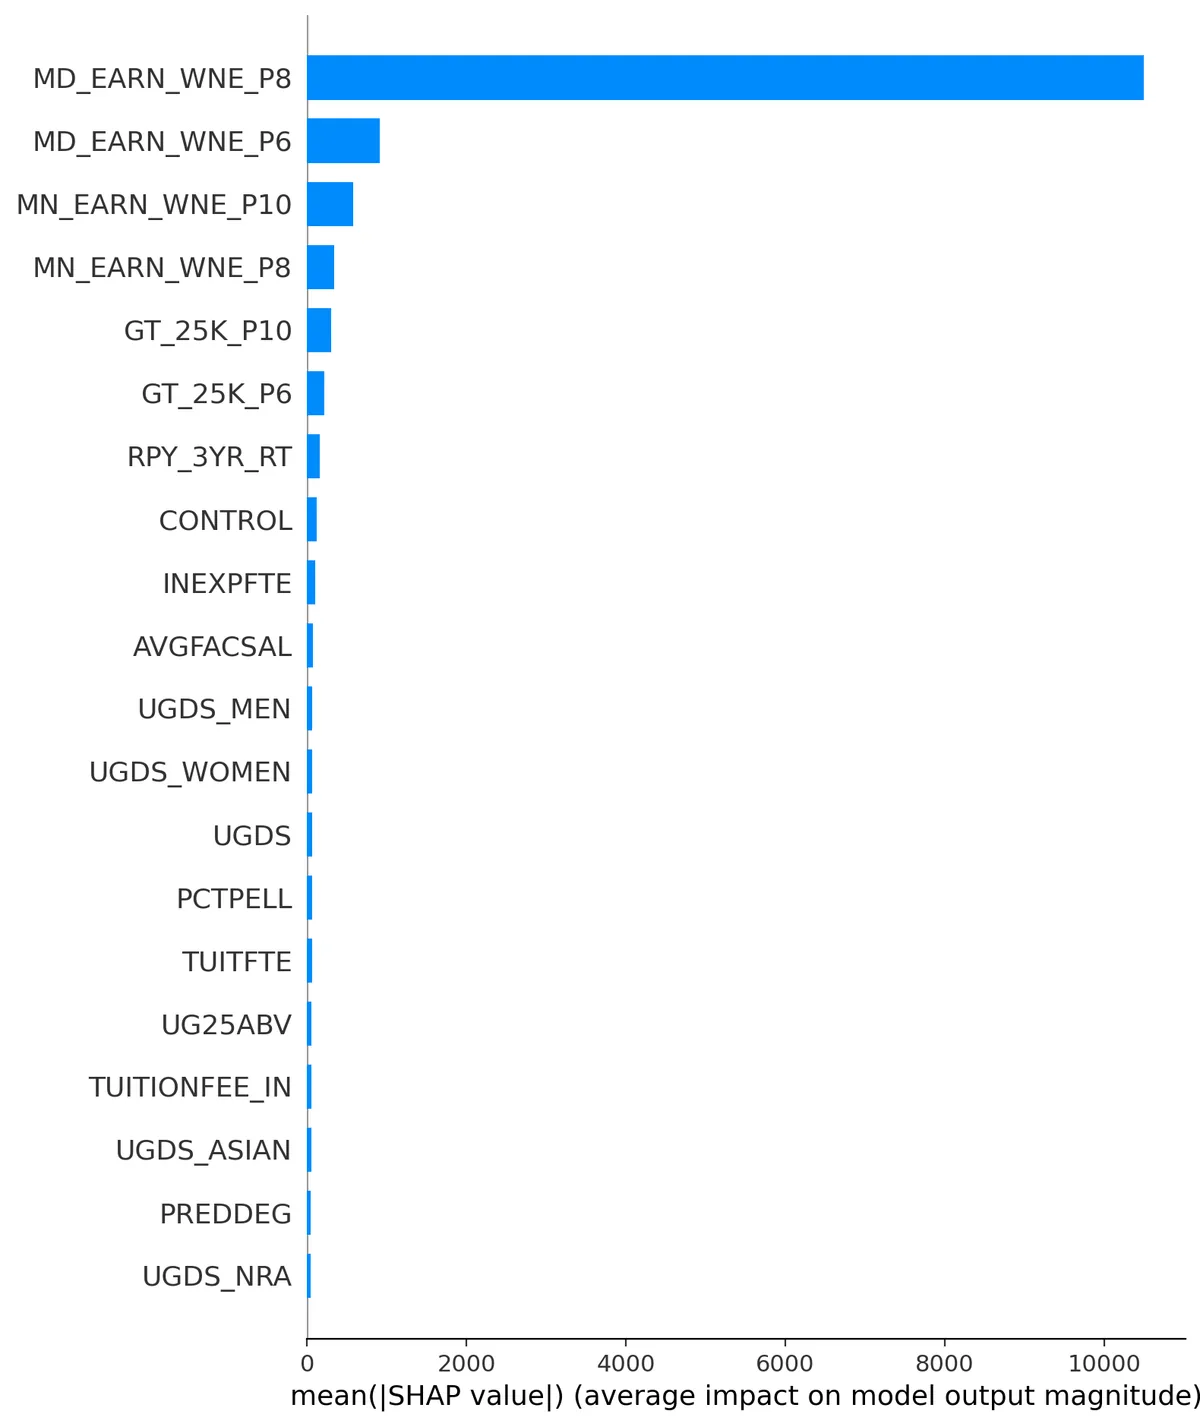
Mean absolute SHAP value per feature for the College Scorecard Random Forest earnings model (5,280 institutions, 35 features; the 20 largest are shown). Median earnings eight years after entry is about 11x the next feature, and several other top features are also earnings measures, so the model's R-squared of 0.9342 is dominated by earnings predicting earnings. SHAP shows how the model attributes its output, not causal effects. Part of a solo collection; the course-review study uses synthetic, template-generated data.
Highlights
- Harmonized 28 IPEDS survey files across seven years (2018 to 2024) into a canonical schema, 3,055,192 rows, auto-detecting 47 cross-year schema changes and removing 6,661 duplicate rows
- Modelled post-graduation earnings across 5,280 institutions on 35 features, comparing Random Forest, XGBoost, and Ridge under 5-fold cross-validation (best R-squared 0.934 with Random Forest, MAE $2,311) with SHAP attribution
- BERTopic with UMAP and HDBSCAN over 238 ERIC policy abstracts (2018 to 2026), converging on 3 topics with a 4,367-term vocabulary
- Aspect-level sentiment over 5,000 synthetic course reviews across 12 departments, aggregated in DuckDB
How it was built
I built four separate studies on US higher-education data. For IPEDS I wrote a pipeline that profiles 28 survey files across seven years, detects schema changes between years, and merges them into one table of about 3.06 million rows. For College Scorecard I compared Random Forest, XGBoost and Ridge on earnings with cross-validation and explained the best model with SHAP. I also topic-modelled 238 ERIC abstracts with BERTopic and analysed synthetic course-review sentiment in DuckDB. Limits: the earnings model largely predicts earnings from other earnings measures, the review data is synthetic and the notebooks are empty stubs.